
Last 24 Hours
A detailed look at station conditions during the most recent 24-hour period.
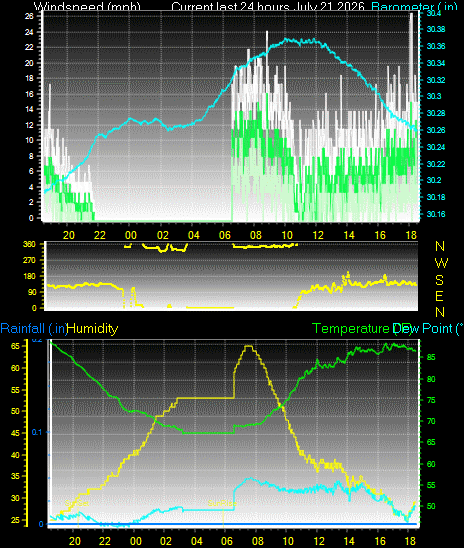

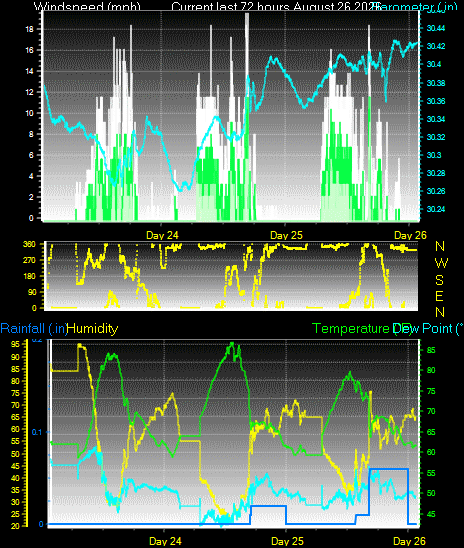
Visual weather trends from this station. Compare recent temperature, humidity, pressure, wind and rainfall patterns across the last 24 hours, last 72 hours and the current month.
A detailed look at station conditions during the most recent 24-hour period.
A broader three-day view that makes short-term weather changes easier to compare.
The current month so far, useful for seeing longer temperature and precipitation trends.
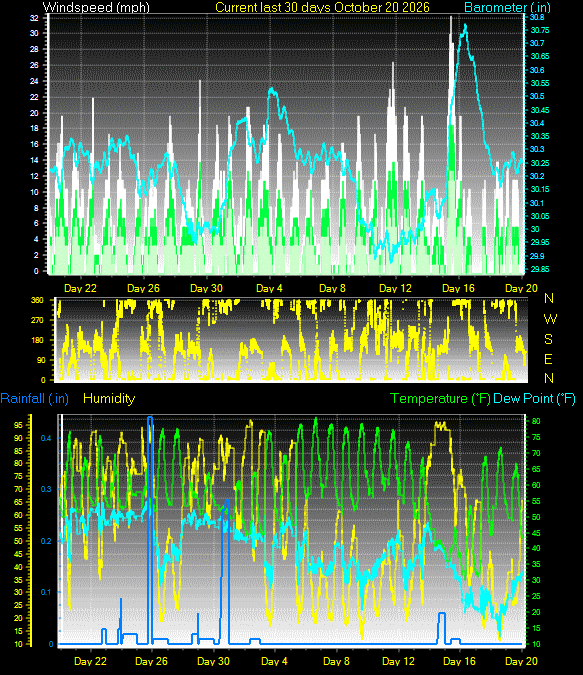
Look for daytime warming, overnight cooling and humidity changes. Sharp changes can mark fronts, storms or shifts in air mass.
Pressure trends can help show approaching or departing weather systems. Wind speed and direction provide additional context for those changes.
Rainfall plots show when precipitation occurred and how totals developed during the selected graph period.

